Welcome to Bio Basic Asia Pacific Pte Ltd
This website uses cookies to ensure the best experience. By continuing, you agree to our Privacy Policy.

How to Read Sanger Sequencing Results: A Guide to Troubleshooting Chromatograms
Sanger sequencing remains one of the most reliable methods for verifying DNA sequences. It is widely used for plasmid validation, mutation confirmation, and targeted gene analysis. However, interpreting the results is not always straightforward.
Many guides explain the theory behind Sanger sequencing, but fewer show researchers how to recognise and troubleshoot problematic chromatograms. Mixed peaks, noisy signals, or unreadable regions can occur for several reasons, ranging from template quality issues to sequencing artefacts.
By learning how to interpret chromatogram patterns, researchers can often identify the root cause and decide whether the data can still be used or if the sample needs to be re-run.
How Sanger Sequencing Data Is Generated
Sanger sequencing works by producing DNA fragments that terminate at different positions during replication. Each terminating nucleotide carries a fluorescent label. When these fragments pass through a capillary electrophoresis system, the instrument detects the fluorescent signals and reconstructs the DNA sequence.
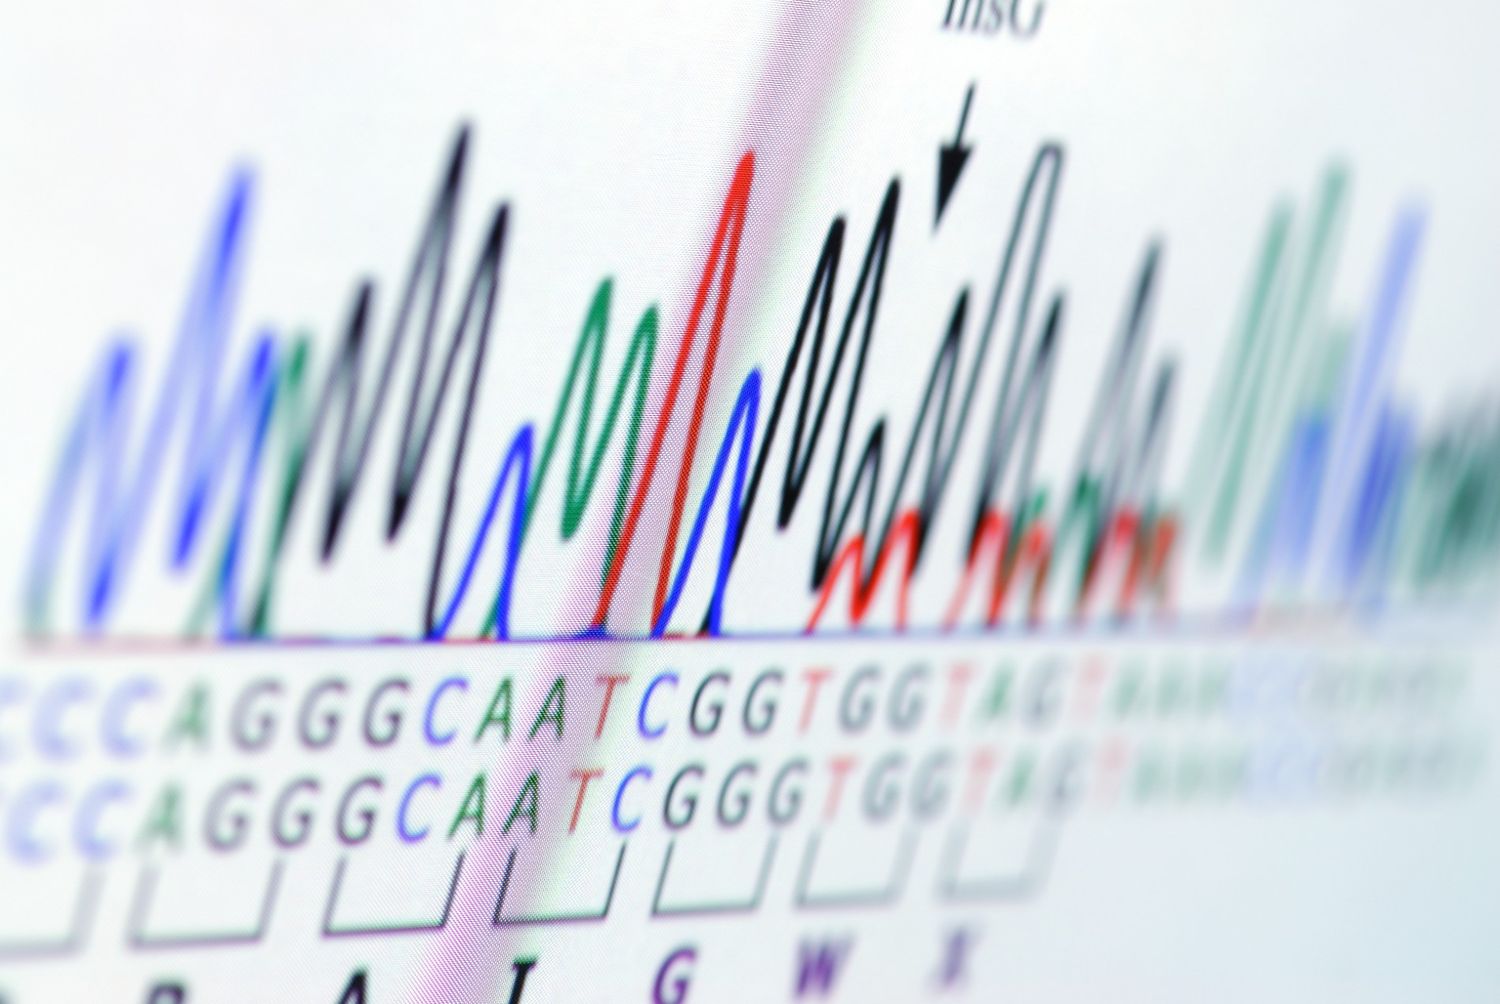
The output is typically presented as a chromatogram, where coloured peaks represent the four nucleotides: image of a chromatogram?

- A (green)
- T (red)
- C (blue)
- G (black)
Each peak corresponds to a base in the sequence. Clean, well-separated peaks usually indicate high-quality data.
At Bio Basic Asia Pacific, our sequencing platform uses capillary electrophoresis of fluorescent-labelled DNA fragments, which allows us to achieve consistent read lengths of 800 to 1000 base pairs per reaction. This ensures researchers obtain as much usable sequence information as possible from each sample.
What Good Quality Sequencing Data Looks Like
Before diagnosing problems, it helps to understand what a high-quality chromatogram should look like.
A good chromatogram typically shows:
- Clear, evenly spaced peaks
- Minimal background noise
- Little or no overlapping signals
- Consistent peak heights across the read
Understanding Phred Quality Scores
Sequencing software often assigns Phred scores to each base call. These scores estimate the probability that a base was incorrectly identified.
Common interpretations include:
| Phred Score | Base Call Accuracy |
|---|---|
| Q20 | 99% accuracy |
| Q30 | 99.9% accuracy |
| Q40 | 99.99% accuracy |
In most sequencing workflows, bases with Phred scores above 20 are considered reliable. Lower scores often appear toward the end of reads where signal strength gradually decreases.
If the majority of the sequence has high Phred scores and clean peaks, the data is usually suitable for downstream analysis.
Common Chromatogram Problems and What They Mean
Even well-prepared samples can produce irregular chromatograms. Recognising typical patterns helps determine whether the issue originates from the template, the sequencing reaction, or the DNA structure itself.
Mixed Peaks
One of the most common chromatogram issues is mixed peaks, where two or more signals overlap at the same position.
This usually appears as:
- Double peaks at multiple positions
- Unclear base calls throughout the sequence
- Overlapping colours in the chromatogram
Common causes include:
- Mixed DNA templates
- Contaminated plasmid preparations
- Multiple colonies picked for plasmid sequencing
- Heterozygous mutations in genomic DNA samples
For plasmid sequencing, the simplest solution is often to sequence DNA from a single colony. This ensures that only one plasmid population is present in the reaction.
Dye Blobs
Dye blobs are another frequent artefact in Sanger sequencing chromatograms. They appear as large, broad peaks that do not correspond to any real nucleotide signal.
These artefacts are usually located near the beginning of the sequence.
They typically result from:
- Incomplete removal of fluorescent dye terminators
- Poor reaction clean-up before capillary electrophoresis
Although dye blobs can obscure several bases, they rarely affect the entire read. In many cases, usable data begins shortly after the affected region.
Selecting appropriate clean-up methods, such as enzymatic clean-up or magnetic bead purification, can reduce this issue.
DNA Polymerase Slippage
DNA polymerase slippage occurs when the enzyme temporarily loses its position during replication. This commonly happens in repetitive regions of DNA.
In chromatograms, polymerase slippage may produce:
- Sudden shifts in peak spacing
- Repeated or missing bases
- Unstable peak patterns
This issue is especially common in microsatellite regions or tandem repeats. When sequencing such regions, it is helpful to confirm the sequence using reads from both forward and reverse primers.
Homopolymeric Regions
Homopolymeric sequences consist of long stretches of the same nucleotide, such as multiple A or T bases in a row.
These regions can cause:
- Compressed peaks
- Reduced signal clarity
- Difficulty distinguishing the exact number of repeated bases
- Early termination and drop off in signals following homopolymeric repeats
While Sanger sequencing handles homopolymers better than many other technologies, long repeats can still affect base-calling accuracy.
In these cases, sequencing from the opposite direction can sometimes improve read quality.
Secondary Structures
DNA templates can sometimes form secondary structures such as hairpins or loops. These structures can interfere with polymerase movement during the sequencing reaction.
Chromatogram signs of secondary structure include:
- Sudden drop in signal quality
- Strong peaks followed by unreadable regions
- Premature termination of the read
Primer-related issues can also contribute to failed sequencing reactions. Poor primer design may lead to weak binding, non-specific amplification, or noisy chromatograms.
While GC-rich primers generally provide stronger and more stable binding to the template, excessively high GC content can increase the risk of primer-dimer formation and secondary structures within the primer itself. These issues may interfere with the sequencing reaction and reduce overall read quality.
When submitting sequencing samples, it is helpful to inform the sequencing team if the template contains hairpin loops or GC-rich regions. This allows adjustments to the sequencing protocol if needed.
Template Quality Matters More Than Most Researchers Think
Many sequencing issues originate from the DNA template rather than the sequencing process itself.
Common template-related problems include:
- Degraded DNA samples
- Low DNA concentration
- Contaminants from plasmid preparation
- Mixed bacterial colonies in plasmid sequencing
Before submitting samples, it is good practice to:
- Verify DNA integrity on a gel
- Ensure the concentration meets recommended ranges
- Confirm plasmids come from a single colony isolation
Contaminants in DNA samples can also interfere with sequencing quality. Researchers often use NanoDrop measurements to assess sample purity before sequencing. The A260/A230 ratio helps detect contaminants such as ethanol, isopropanol, or residual salts from purification steps, while the A260/A280 ratio provides an indication of protein contamination.
These contaminants can inhibit Taq polymerase activity during sequencing, resulting in low signal intensity, increased background noise, or poor-quality chromatograms. Proper sample purification is therefore important for obtaining reliable sequencing results.
Improving Sequencing Results Through Better Primer Design
Primer design also plays a key role in sequencing quality.
Poor primer selection can cause weak signals, noisy chromatograms, or incomplete reads. When designing sequencing primers, researchers should aim for:
- Primer length of 18 to 25 bases
- Balanced GC content between 40 and 60 percent
- Minimal secondary structure or self-complementarity
- Avoidance of repetitive regions
To simplify primer selection, we provide over 100 free universal primers that can be used for common plasmid vectors and sequencing applications.
Using validated primers often improves sequencing reliability and reduces troubleshooting time.
When a Second Sequencing Run Helps
Sometimes, repeating the sequencing reaction can significantly improve results.
At Bio Basic Asia Pacific, we offer one additional re-sequencing run upon request. In many cases, the second run benefits from adjustments based on observations from the initial chromatogram.
For example, the sequencing protocol may be modified if we identify:
- GC-rich template regions
- Hairpin structures
- Low template concentration
These adjustments can often produce clearer sequencing reads.
Conclusion
Learning to read chromatograms is an important skill for researchers who rely on Sanger sequencing for DNA analysis. By recognising patterns such as mixed peaks, dye blobs, polymerase slippage, and secondary structures, it becomes much easier to diagnose sequencing problems.
In many cases, improving template quality, selecting better primers, or repeating the sequencing reaction can resolve these issues. When sequencing data is interpreted carefully, even imperfect chromatograms can still provide valuable information.
With accurate sequencing workflows and proper troubleshooting, Sanger sequencing continues to be one of the most dependable methods for verifying DNA sequences in molecular biology research.
